在同一情节上制作具有多个痕迹的情节性子情节。
所以我正在制作子图,我计划放在一个超文本标记语言文件上以供网络查看。然而,问题是我的每个图都有多个痕迹,并且是在px. line中制作的。好吧,所以我尝试使用go.Scatter制作一个有多个痕迹的图,但这也不起作用。
这是当前代码:
import pandas as pd
import plotly.express as px
import plotly.graph_objects as go
import plotly
from itertools import cycle
from plotly.subplots import make_subplots


#below code imports file needed at the moment
F62Ext1 = pd.read_csv("F6-2_Ext1.csv")
F62Ext2 = pd.read_csv("F6-2_Ext2.csv")


#using a savgol filter to smooth out data in python
from scipy.signal import savgol_filter
#definition of savgol filter for dataframe written below
def savgol(x):
    return savgol_filter(x,101,6)
F62Ext1_smoothed = F62Ext1.apply(savgol)
F62Ext2_smoothed = F62Ext2.apply(savgol)

F62E1_CH1 = go.Scatter(x = F62Ext1_smoothed['Time'], y = [F62Ext1_smoothed['CH1'],F62Ext1['ActivePoke'], F62Ext1['CueLight']], name = "F62Ext1, Channel 1")
F62E2_CH1 = go.Scatter(x = F62Ext2_smoothed['Time'], y = [F62Ext2_smoothed['CH1'],F62Ext2['ActivePoke'], F62Ext2['CueLight']], name = "F62Ext2, Channel 1")

fig = make_subplots(rows = 1, cols = 2, shared_yaxes = True)
fig.add_trace(F62E1_CH1, row = 1, col = 1)
fig.add_trace(F62E2_CH1, row = 1, col = 2)
产生以下结果:go. Scatter图
然而,我试图获得的是这个:带有多个痕迹的px. line图
如何更正此错误?
编辑:F62E1的判决书如下:
{'Time': {0: 0.0, 1: 0.1, 2: 0.2, 3: 0.3, 4: 0.4},
 'CH1': {0: -0.169504148,
  1: -0.372732867,
  2: -0.323666804,
  3: -0.352484157,
  4: -0.327975913},
 'CH2': {0: -0.188884746,
  1: -0.301823346,
  2: -0.13172756,
  3: -0.456077945,
  4: -0.543653381},
 'CH3': {0: 0.03599356,
  1: -0.029965731,
  2: 0.014807156,
  3: -0.06392204,
  4: -0.041387216},
 'CH4': {0: -0.082626583,
  1: -0.071240774,
  2: -0.055854863,
  3: -0.137854075,
  4: -0.134953954},
 'CH5': {0: -0.104248439,
  1: -0.241010992,
  2: -0.249843885,
  3: -0.306350559,
  4: -0.223923059},
 'CH6': {0: -0.020229121,
  1: -0.359940514,
  2: -0.229173544,
  3: -0.266795437,
  4: -0.278069671},
 'CH7': {0: -0.209219168,
  1: -0.255944829,
  2: -0.215244963,
  3: -0.290505347,
  4: -0.28456927},
 'CH8': {0: 0.093962928,
  1: 1.2574526,
  2: 1.75068895,
  3: 1.356159013,
  4: 0.676462295},
 'CH9': {0: -0.150238434,
  1: -0.167165814,
  2: -0.057212299,
  3: -0.20998062,
  4: -0.351662263},
 'CH10': {0: -0.306078824,
  1: -0.399363635,
  2: -0.281349569,
  3: -0.53463429,
  4: -0.383537615},
 'CH11': {0: -0.189443456,
  1: -0.161361134,
  2: -0.223323043,
  3: -0.338406151,
  4: -0.339504188},
 'CH12': {0: -0.174074045,
  1: -0.230008948,
  2: -0.255067313,
  3: -0.380150306,
  4: -0.393756259},
 'CH13': {0: -0.123562058,
  1: -0.271150428,
  2: -0.251144972,
  3: -0.379664224,
  4: -0.393714865},
 'CH14': {0: -0.233391565,
  1: -0.276967731,
  2: -0.236738984,
  3: -0.44725073,
  4: -0.455074619},
 'CH15': {0: -0.234460706,
  1: -0.368129274,
  2: -0.264646375,
  3: -0.438000119,
  4: -0.40056134},
 'CH16': {0: -0.267852578,
  1: -0.224666613,
  2: -0.189448701,
  3: -0.291014541,
  4: -0.387302535},
 'ActivePoke': {0: 0, 1: 0, 2: 0, 3: 0, 4: 0},
 'CueLight': {0: 0, 1: 0, 2: 0, 3: 0, 4: 0},
 'Pump': {0: 0, 1: 0, 2: 0, 3: 0, 4: 0},
 'InactivePoke': {0: 0, 1: 0, 2: 0, 3: 0, 4: 0}}
我认为问题是,策略性地无法理解这个痕迹:
F62E1_CH1 = go.Scatter(x = F62Ext1_smoothed['Time'], y = [F62Ext1_smoothed['CH1'],F62Ext1['ActivePoke'], F62Ext1['CueLight']], name = "F62Ext1, Channel 1")
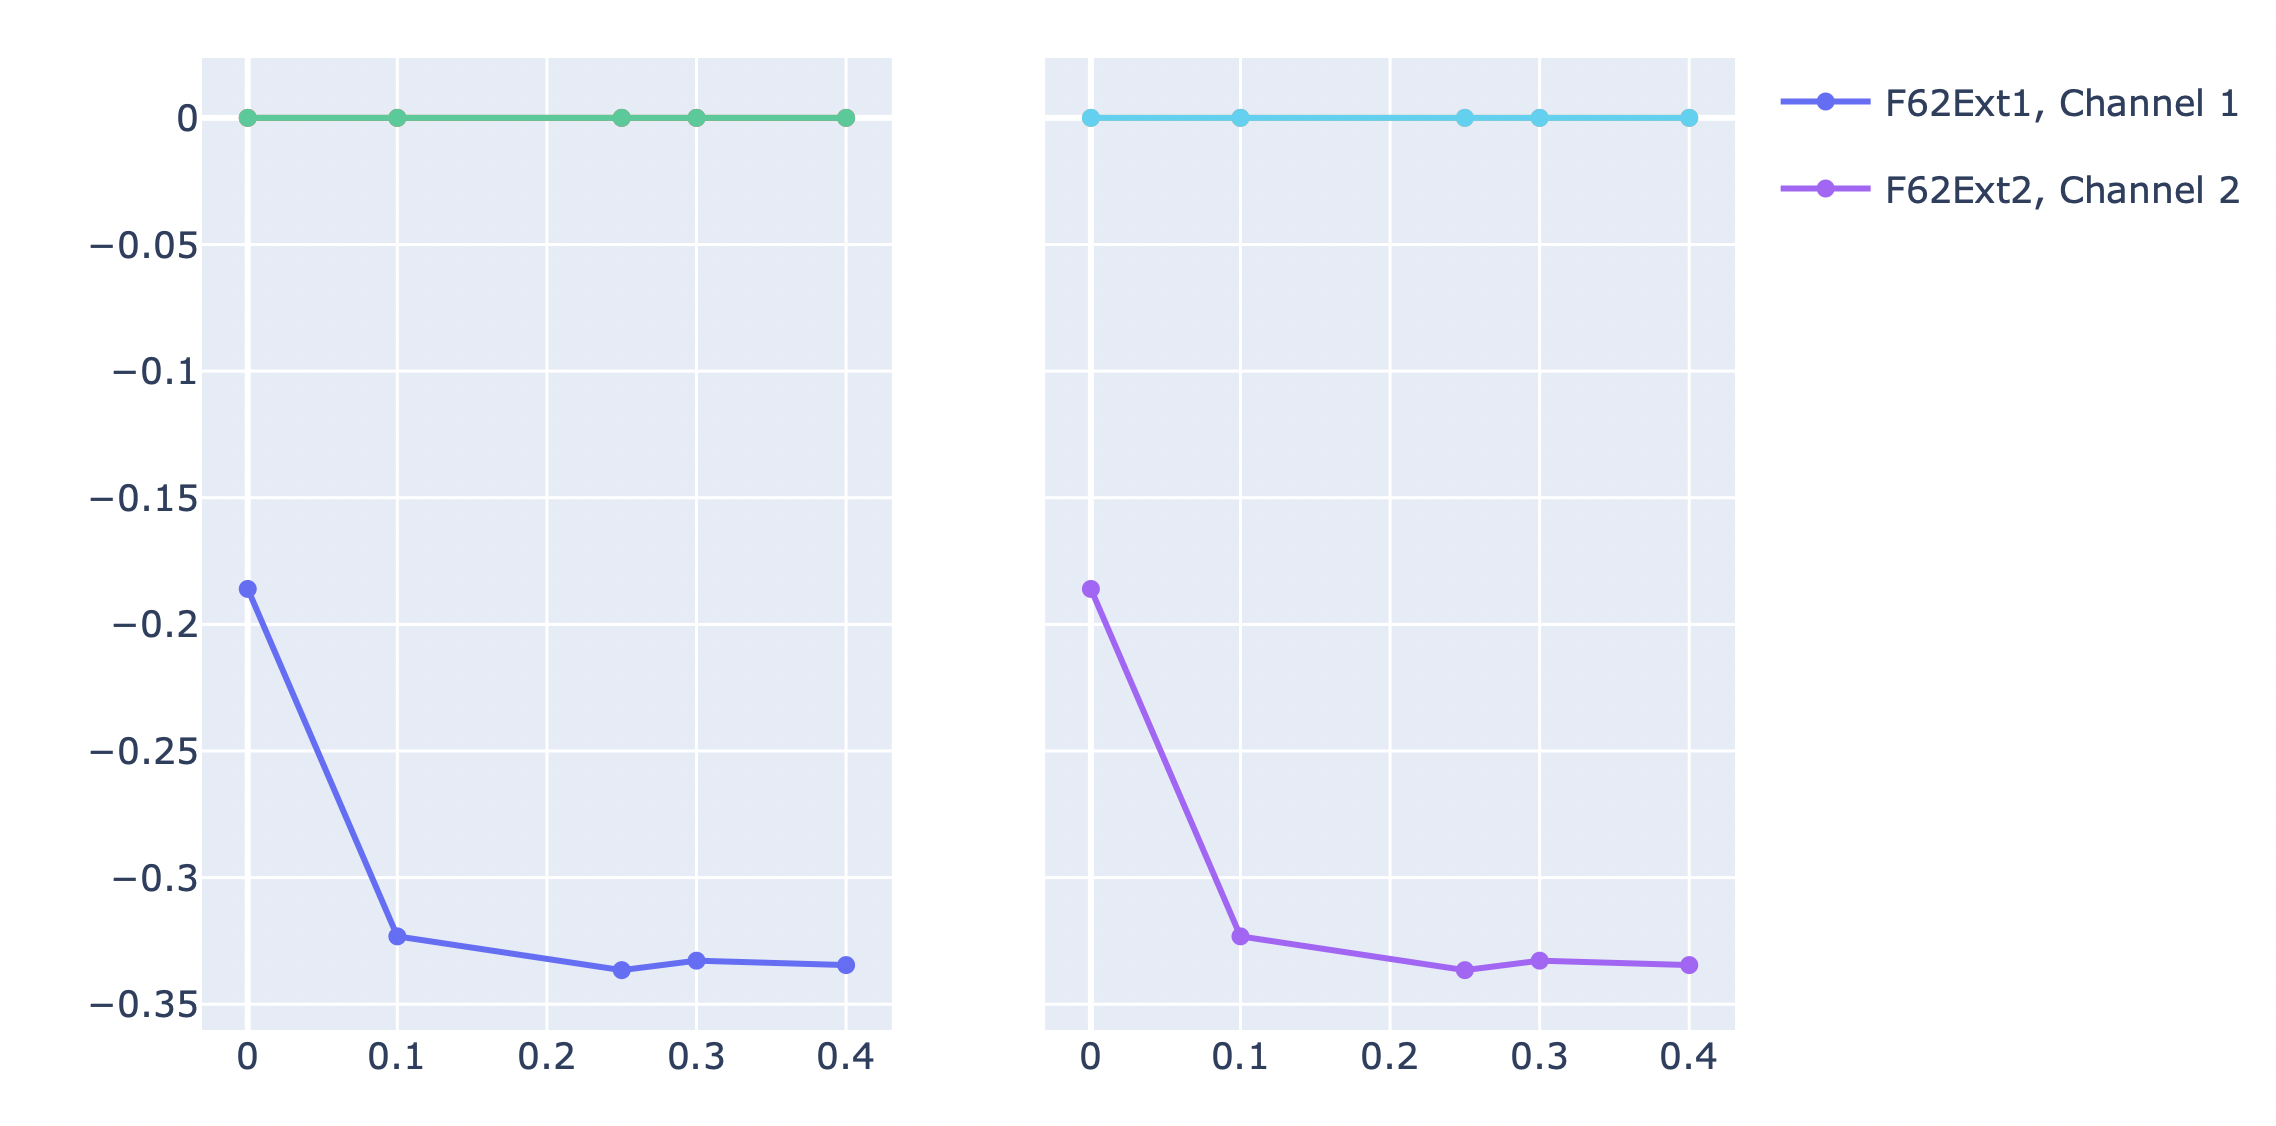
相反,您可以将go. Scatter对象存储在列表中,然后遍历它们以单独添加跟踪。我还使用了参数legendgroup和showLegal,以便可以一起选择或取消选择子图的所有跟踪-如果没有必要,可以删除。
例如:
F62E1_CH1_traces = [
    go.Scatter(
        x = F62Ext1_smoothed['Time'],
        y = y,
        name = "F62Ext1, Channel 1",
        legendgroup = "F62Ext1, Channel 1",
        showlegend = showlegend
    ) for y, showlegend in zip(
        [F62Ext1_smoothed['CH1'],F62Ext1['ActivePoke'], F62Ext1['CueLight']],
        [True, False, False]
    )
]
F62E1_CH2_traces = [
    go.Scatter(
        x = F62Ext2_smoothed['Time'],
        y = y,
        name = "F62Ext2, Channel 2",
        legendgroup = "F62Ext2, Channel 2",
        showlegend = showlegend
    ) for y, showlegend in zip(
        [F62Ext2_smoothed['CH1'],F62Ext2['ActivePoke'], F62Ext2['CueLight']],
        [True, False, False]
    )
]

fig = make_subplots(rows = 1, cols = 2, shared_yaxes = True)
for F62E1_CH1_trace in F62E1_CH1_traces:
    fig.add_trace(F62E1_CH1_trace, row = 1, col = 1)
for F62E1_CH2_trace in F62E1_CH2_traces:
    fig.add_trace(F62E1_CH2_trace, row = 1, col = 2)
fig.show()