
这是我绘制和保存图形的代码示例:
我正在使用Python 3.7。4和matplotlib==3.0。3.
import matplotlib.pyplot as plt
import pandas as pd
from yahoo_fin import stock_info
import statsmodels.api as sm

brk_data = stock_info.get_data("BRK-A")

with plt.style.context('dark_background'):

    fig, ax = plt.subplots(figsize=(16, 9))
    sm.qqplot(brk_data['adjclose'].pct_change(1).fillna(0), fit=True, line='45', ax=ax)
    plt.title('QQ Plot', fontsize = 16)
    ax.axvline(0, c  = 'w', linestyle = "--", alpha = 0.5)
    ax.grid(True,linewidth=0.30)
    ax.set_xlim(4,-4)
    ax.set_ylim(5,-5)

    plt.savefig('qqplot.png', bbox_inches = 'tight', pad_inches = 0.4, dpi = 300, edgecolor = 'k')
    plt.show()
    plt.close()
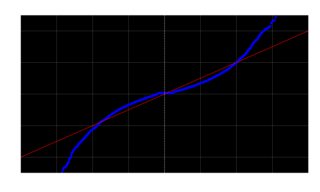
此代码正确保存并显示绘图图形,如下所示:

但是,当在函数中构建绘图时,保存的图片背景将保持白色,使“暗背景”样式中的白色记号和标签不可见,例如:
对于
def qqplot2(pct, save = False):

    with plt.style.context('dark_background'):

        fig, ax = plt.subplots(figsize=(16, 9))
        sm.qqplot(pct, fit=True, line='45', ax=ax)
        plt.title('QQ Plot', fontsize = 16)
        ax.axvline(0, c  = 'w', linestyle = "--", alpha = 0.5)
        ax.grid(True,linewidth=0.30)
        ax.set_xlim(4,-4)
        ax.set_ylim(5,-5)


    if save == True:

        plt.savefig('qqplot2.png', bbox_inches = 'tight', pad_inches = 0.4, dpi = 300, edgecolor = 'k')
        plt.show()
        plt.close()

    else:

        plt.show()
使用qqplot2调用函数(brk_data['adjclose'].pct_change(1)。fillna(0),save=True)将显示正确的绘图:
但会错误地保存该数字:
您只需要在函数中缩进if子句,如下所示:
def qqplot2(pct, save = False):

    with plt.style.context('dark_background'):

        fig, ax = plt.subplots(figsize=(16, 9))
        sm.qqplot(pct, fit=True, line='45', ax=ax)
        plt.title('QQ Plot', fontsize = 16)
        ax.axvline(0, c  = 'w', linestyle = "--", alpha = 0.5)
        ax.grid(True,linewidth=0.30)
        ax.set_xlim(4,-4)
        ax.set_ylim(5,-5)


        if save == True:

            plt.savefig('qqplot2.png', bbox_inches = 'tight', pad_inches = 0.4, dpi = 300, edgecolor = 'k')
            plt.show()
            plt.close()

        else:

            plt.show()
