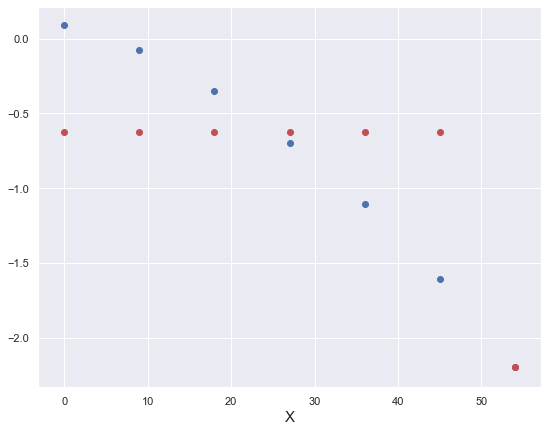

我试图使用curve_fit(Scipy.optimize)拟合一条指数曲线,但拟合后的曲线与实际曲线完全不同。现在我正在使用以下代码:
X=[0.0, 9.0, 18.0, 27.0, 36.0, 45.0, 54.0]
Y=[0.090316199, -0.078157925, -0.350137315, -0.695193468, -1.106773689, -1.60467115, -2.196169408]

#plot Y against X
fig = plt.figure(num=None, figsize=(9, 7),facecolor='w', edgecolor='k')
ax=fig.add_subplot(111)
ax.scatter(X,Y)

#fit using curve_fit
popt, pcov = curve_fit(func, X, Y,maxfev=10000)

#compute Y_estiamted using fitted parameters
Y_estimated=[popt[0]*np.exp(i+popt[1])+popt[2] for i in X]

#plot Y_estiamted against X
ax.scatter(X,Y_estimated, c='r')

def func(x,a,b,c):
    return a*(np.exp(x+b))+c

正如你所看到的,拟合的红色曲线根本不匹配真正的蓝色曲线。任何帮助都将不胜感激!
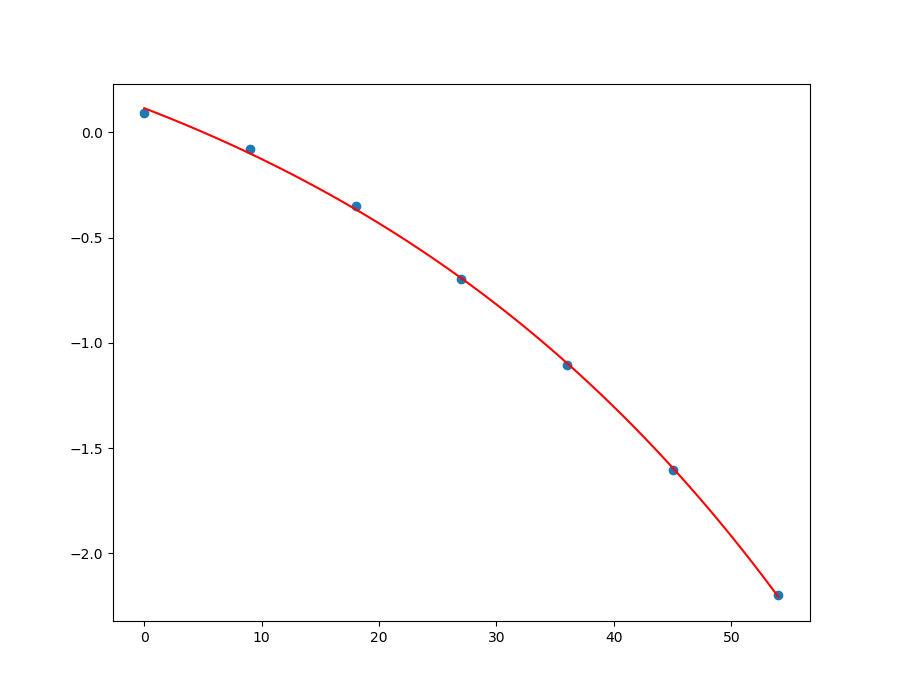
我认为问题是模型函数。如果将其更改为如下函数:
def func(x, a, b, c, d):
    return a * (np.exp(d*(x + b))) + c

我在代码中更改了一些内容:
def func(x, a, b, c, d):
    return a * (np.exp(d*(x + b))) + c


X = [0.0, 9.0, 18.0, 27.0, 36.0, 45.0, 54.0]
Y = [0.090316199, -0.078157925, -0.350137315, -0.695193468, -1.106773689, -1.60467115, -2.196169408]


# plot Y against X
fig = plt.figure(num=None, figsize=(9, 7), facecolor='w', edgecolor='k')
ax = fig.add_subplot(111)
ax.scatter(X, Y)

# fit using curve_fit
popt, pcov = curve_fit(func, X, Y, maxfev=10000)

# compute Y_estiamted using fitted parameters
x = np.linspace(min(X), max(X), 100)
Y_estimated = func(x, *popt)

# plot Y_estiamted against X
ax.plot(x, Y_estimated, c='r')