
前面的一个问题涉及使用Savefig()以与屏幕上显示的相同的颜色(背景颜色)进行保存,即:
fig = plt.figure()
fig.patch.set_facecolor('blue')
fig.savefig('foo.png', facecolor=fig.get_facecolor())
matplotlib图形facecolor(背景颜色)
(使用savefig()需要我们重新指定背景色。)
我还可以为透明度指定一个alpha,例如:如何在Matplotlib中设置图形背景颜色的不透明度
fig.patch.set_alpha(0.5)
我找不到一种方法,使图形在屏幕上显示时保存为透明的facecolor。以下方面的文档似乎不完整:http://matplotlib.org/faq/howto_faq.html#save-透明的数字-实际的节省没有显示出来。将transparent=True与savefig()一起使用,并没有达到使facecolor透明的预期效果,相反,它似乎使除该颜色(包括图形背景)上的轴图例之外的所有内容都透明。
编辑:代码的一些相关摘录:
def set_face_color(fig, facecolor):
    if facecolor is False:
        # Not all graphs get color-coding
        facecolor = fig.get_facecolor()
        alpha = 1
    else:
        alpha = 0.5
    color_with_alpha = colorConverter.to_rgba(
        facecolor, alpha)
    fig.patch.set_facecolor(color_with_alpha)

def save_and_show(plt, fig, save, disp_on, save_as):
    if save:
        plt.savefig(save_as, dpi=dpi_file, facecolor=fig.get_facecolor(),
                    edgecolor='none')
    if disp_on is True:
        figManager = plt.get_current_fig_manager()
        figManager.window.showMaximized()
        plt.show()
    else:
        plt.close('all')
也许可以将它们结合起来,但是我经常在绘图函数的开头调用set_face_color(),然后在构建子图网格之前,然后在最后调用save_and_show()。我想它应该在任何一个地方都可以工作,但是最佳情况下,我更喜欢保持函数的分离,并且能够从最终的图中提取传递给Savefig()的alpha。
编辑2-值千言万语
Alpha=左侧0.5,右侧1。
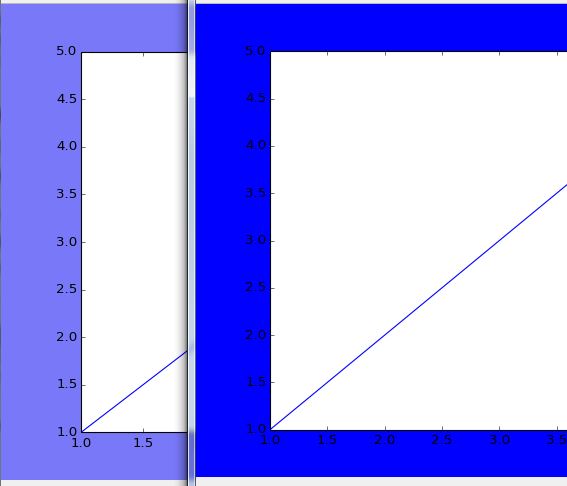
t = [1, 2, 3, 4, 5]
fig = plt.figure()
fig.patch.set_alpha(0.5)
fig.set_facecolor('b')
plt.plot(t, t)
fig2 = plt.figure()
fig2.set_facecolor('b')
plt.plot(t,t)
我在Matplotlib 1.5上运行了您的代码,发现它为我生成了预期的输出。对于将来发生的一切,我在下面给出两种实现这一点的简明方法。
请注意,您肯定不想将transparent=True设置为savefig的选项,因为这将覆盖matplotlib中显示的面颜色。图.savefig源。
为了真正解决你的问题,你发布的第二个链接如何设置图形背景颜色的不透明度,Matplotlib实际上解决了这个问题。问题中的代码片段的问题是使用fig.set_facecolor而不是fig.patch.set_facecolor
从上面的链接问题中,使用facecolor参数保存图
import matplotlib.pyplot as plt

fig = plt.figure()
fig.patch.set_facecolor('b') # instead of fig.patch.set_facecolor
fig.patch.set_alpha(0.5)

plt.plot([1,3], [1,3])
plt.tight_layout()
plt.show()
plt.savefig('method1.png', facecolor=fig.get_facecolor())
您还可以通过rcParams指定savefig facecolor。
import matplotlib.pyplot as plt
import matplotlib as mpl

fig = plt.figure()

col = 'blue'
#specify color of plot when showing in program.
#fig.set_facecolor(col) also works
fig.patch.set_facecolor(col)
#specify color of background in saved figure
mpl.rcParams['savefig.facecolor'] = col

#set the alpha for both plot in program and saved image
fig.patch.set_alpha(0.5)
plt.plot([1,3], [1,3])
plt.tight_layout()
plt.show()
plt.savefig('method2.png')
如果你想让你的Axis有一个背景,这些解决方案应该保持这个背景(比如由seaborn在Erotemic的评论中制作的)不变。如果您想更明确地说明这一点,请添加:
ax.patch.set_color('palegoldenrod') # or whatever color you like
ax.patch.set_alpha(.7)
axis patch alpha将转移到savefig,无需额外操作。
注意,在这两种情况下,我都使用了plt。tight_layout()以消除已保存图形中无用的额外空间。您可以在matplotlib文档中阅读更多有关此方面的内容。
