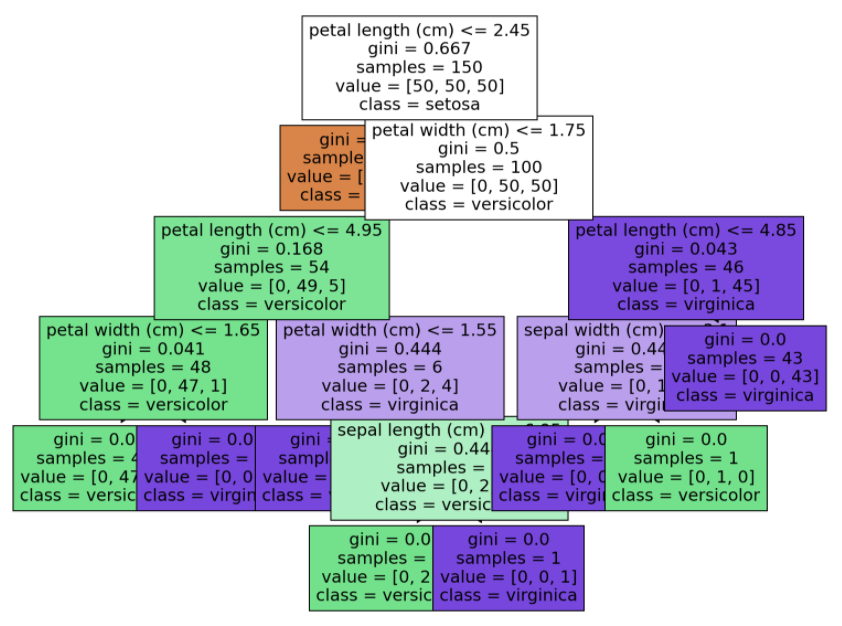

有没有办法在木星笔记本上“卸载”下面的树?这是一个简单的决策树,但我不知道是什么让它看起来崩溃了。以下是相关的代码片段和树本身。
%matplotlib inline
%config InlineBackend.figure_format = 'retina'
from matplotlib import pyplot as plt
plt.rcParams['figure.figsize'] = (10, 8)

import numpy as np
import pandas as pd
from sklearn.preprocessing import LabelEncoder
import collections
from sklearn.model_selection import GridSearchCV, cross_val_score
from sklearn.tree import DecisionTreeClassifier, plot_tree
from sklearn.ensemble import RandomForestClassifier
from sklearn.metrics import accuracy_score


#some more code


# Some feature values are present in train and absent in test and vice-versa.
y = df_train['Should_Vacation_there']
df_train, df_test = intersect_features(train=df_train, test=df_test)
df_train

#training a decision tree
dt = DecisionTreeClassifier(criterion='entropy', random_state=17)
dt.fit(df_train, y);

#displaying the tree
plot_tree(dt, feature_names=df_train.columns, filled=True,
         class_names=["Should go there", "Shouldn't go there"]);

#%config InlineBackend。图_format='retina'是罪魁祸首。对其进行注释会生成格式良好的树。
from matplotlib import pyplot as plt
import numpy as np
import pandas as pd
from sklearn.preprocessing import LabelEncoder
import collections
from sklearn.model_selection import GridSearchCV, cross_val_score
from sklearn.tree import DecisionTreeClassifier, plot_tree
from sklearn.ensemble import RandomForestClassifier
from sklearn.metrics import accuracy_score
from sklearn.model_selection import train_test_split
from sklearn.datasets import load_iris

%matplotlib inline
#%config InlineBackend.figure_format = 'retina'

iris = load_iris()
plt.rcParams['figure.figsize'] = (10, 8)

#some more code
X_train, X_test, y_train, y_test = train_test_split(iris.data, iris.target, test_size=0.2)

# Some feature values are present in train and absent in test and vice-versa.
#y = df_train['Should_Vacation_there']
#df_train, df_test = intersect_features(train=df_train, test=df_test)
#df_train

#training a decision tree
dt = DecisionTreeClassifier(criterion='entropy', random_state=17)
dt.fit(X_train, y_train)

#displaying the tree
plot_tree(dt, feature_names=iris.feature_names, filled=True,
         class_names=iris.target_names);

取出%config InlineBackend.figure_format='retina'。用'svg'代替,你会得到很好的分辨率。
from matplotlib import pyplot as plt
from sklearn import datasets
from sklearn.tree import DecisionTreeClassifier
from sklearn import tree

# Prepare the data data
iris = datasets.load_iris()
X = iris.data
y = iris.target

# Fit the classifier with default hyper-parameters
clf = DecisionTreeClassifier(random_state=1234)
model = clf.fit(X, y)
fig = plt.figure(figsize=(25,20))
_ = tree.plot_tree(clf,
                   feature_names=iris.feature_names,
                   class_names=iris.target_names,
                   filled=True)

#2
fig = plt.figure(figsize=(25,20))
_ = tree.plot_tree(clf,
                   feature_names=iris.feature_names,
                   class_names=iris.target_names,
                   filled=True)
