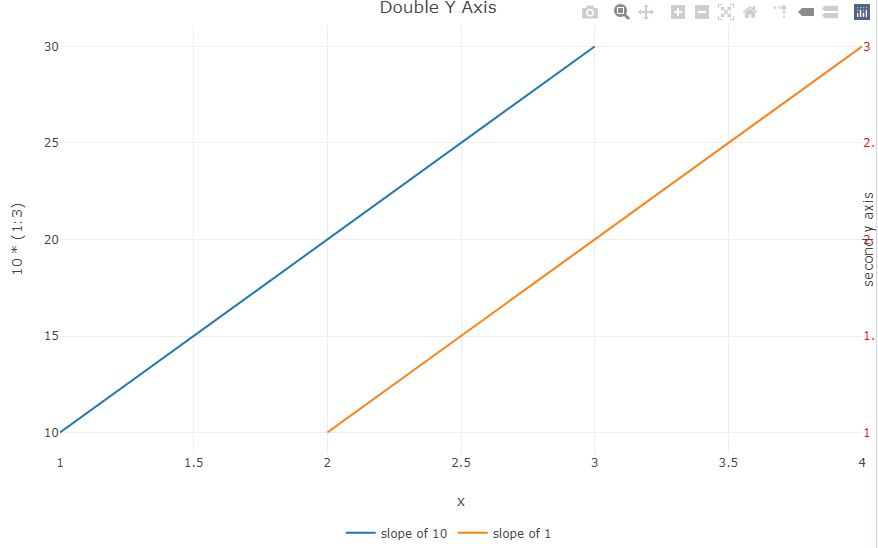

我试图创建一个有两个y轴的绘图图,一个在绘图的左侧,一个在绘图的右侧。我得到了以下(可复制的示例)代码工作:
library(dplyr)
library(plotly)

plot_ly() %>%
  add_lines(x = ~1:3, y = ~10*(1:3), name = "slope of 10") %>%
  add_lines(x = ~2:4, y = ~1:3, name = "slope of 1", yaxis = "y2") %>%
  layout(
    title = "Double Y Axis",
    yaxis2 =  list(tickfont = list(color = "red"),
                   overlaying = "y",
                   side = "right",
                   title = "second y axis"),
    xaxis = list(title="x")
  )
然而,根据我的实际数据,这个图例的位置有点奇怪,并且与y轴刻度标签和标题重叠。因为它是反应性数据,我不知道每种情况下的y轴会是什么样子。因此,我想将图例移动到底部(水平定向),以给y轴更多的空间。虽然我有移动图例的代码(见下面的代码块),但它导致了图形的重新缩放,使得次要的Y轴不可读。正如您在示例图片中看到的,小数不再位于图形区域中,Y轴标题现在与刻度标签重叠。
plot_ly() %>%
  add_lines(x = ~1:3, y = ~10*(1:3), name = "slope of 10") %>%
  add_lines(x = ~2:4, y = ~1:3, name = "slope of 1", yaxis = "y2") %>%
  layout(
    title = "Double Y Axis",
    yaxis2 =  list(tickfont = list(color = "red"),
                   overlaying = "y",
                   side = "right",
                   title = "second y axis"),
    xaxis = list(title="x"),
    legend = list(orientation = 'h', x = 0.35, y = -.15)
  )

是否可以重新缩放绘图以使其可读?我尝试调整次y轴的位置,但这也导致了一个丑陋的结果(因为轴将位于绘图的“中间”)。因此,我更喜欢的结果是y轴及其标题的位置与第一个代码示例中的位置相似,图例(水平方向)位于绘图底部,与第二个代码示例中的位置相同。
您可以在绘图中添加边距(目前仅增加“r”右侧的边距),因为标题固定在右侧。
plot_ly() %>%
  add_lines(x = ~1:3, y = ~10*(1:3), name = "slope of 10") %>%
  add_lines(x = ~2:4, y = ~1:3, name = "slope of 1", yaxis = "y2") %>%
  layout(
    title = "Double Y Axis",
    yaxis2 =  list(tickfont = list(color = "red"),
                   overlaying = "y",
                   side = "right",
                   title = "second y axis"
                   ),
    xaxis = list(title="x"),
    margin = list(
          r = 50
    ),
    legend = list(orientation = 'h', x = 0.35, y = -.15)
  )
示例