
一直在挠头,研究了一段时间,但没有运气。
我有一个javaFX项目,我在其中创建了一个带有4组系列的areachart,其中最后一组只有可见的点(黑色Xs):
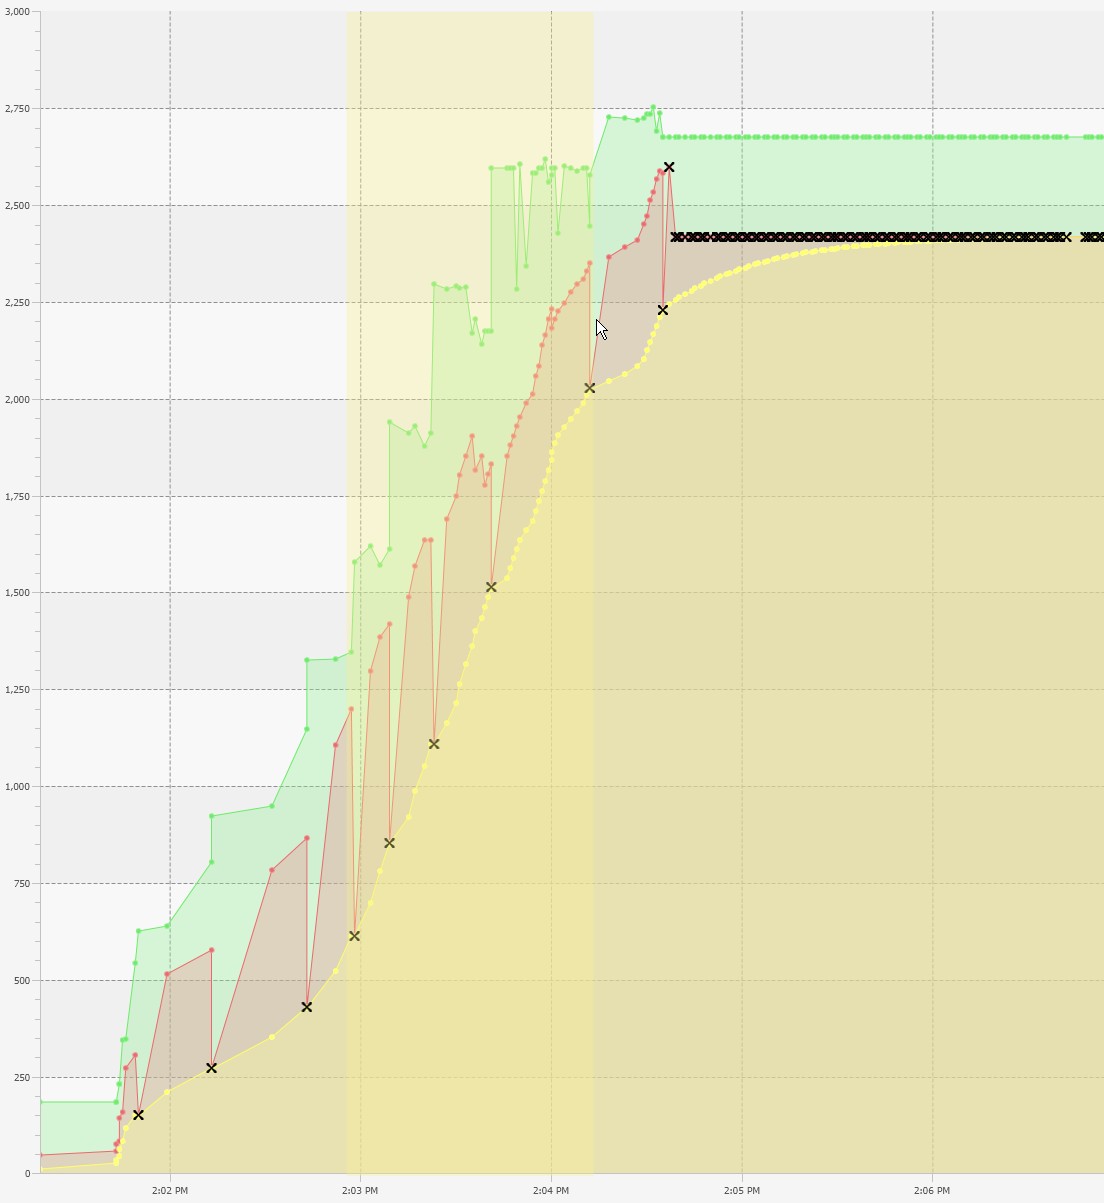
我还实现了通过突出显示一个区域来深入图表的能力。这都是通过各种鼠标处理程序实现的,但本质上它是一个半透明的黄色矩形(高亮显示),可以随着鼠标的拖动而调整大小:
    private void setMouseHandler() {
final Axis<Date> xAxis = gcChart.getXAxis();
final Axis<Number> yAxis = gcChart.getYAxis();
final Node chartBackground = gcChart.lookup(".chart-plot-background");
for (Node n: chartBackground.getParent().getChildrenUnmodifiable()) {
    if (n != chartBackground && n != xAxis && n != yAxis && n != highlight) {
    n.setMouseTransparent(true);
    }
}
chartBackground.setOnMouseEntered(new EventHandler<MouseEvent>() {

    @Override
    public void handle(MouseEvent mouseEvent) {
    if (mouseEvent.isPrimaryButtonDown()){
        exitedChart = false;
    }
    }

});


//grab the initial values so if dragged we have them
chartBackground.setOnMousePressed(new EventHandler<MouseEvent>() {

    @Override
    public void handle(MouseEvent mouseEvent) {

    if (mouseEvent.isPrimaryButtonDown()){
            Bounds chartAreaBounds = yAxis.localToParent(yAxis.getBoundsInParent()); //chartBackground.localToScene(chartBackground.getBoundsInLocal());
            xShift = chartAreaBounds.getMaxX() -10;  //account for Y Axis area on the chart and side tabs
            origX = mouseEvent.getX() + xShift;
            highlight.setVisible(true);
            highlight.setX(origX);
            highlight.setY(chartAreaBounds.getMinY()+xAxis.getHeight());
            highlight.setHeight(chartAreaBounds.getMaxY()-xAxis.getHeight());

            // Don't want to re-render the chart if we are already zoomed out.
            firstSelDate = xAxis.getValueForDisplay(mouseEvent.getX());
    }
    else{
     // Are we zoomed in?
        if (seriesCache.size() >= 2){
            logger.info("Zooming out of chart");
            Platform.runLater(new Runnable() {

            @Override
            public void run() {
                removeChartFromScene();
                // return to last series in cache
                new Thread(new GenerateDataTask(null, null, true)).start();
            }

            });
            firstSelDate = null;
        }
    }

    }

});

//must enable FullDrag to detect a drag entering into nodes other than the chart ie. highlight
chartBackground.setOnDragDetected(new EventHandler<MouseEvent>() {

    @Override
    public void handle(MouseEvent mouseEvent) {
    if (mouseEvent.isPrimaryButtonDown()){
        chartBackground.startFullDrag();
    }
    }

});

chartBackground.setOnMouseDragged(new EventHandler<MouseEvent>() {

    @Override
    public void handle(MouseEvent mouseEvent) {
    if (mouseEvent.isPrimaryButtonDown()){
            //only set drag values if in the bounds of yAxis
            if (!exitedChart){
                double position = mouseEvent.getX() + xShift;
                highlight.setX(origX <= position? origX : position);
                highlight.setWidth(origX <= position? position-origX: origX-position);

                // this may be whats causing the slow drag..
                lastSelDate = xAxis.getValueForDisplay(mouseEvent.getX());
            }
    }
    }

});
chartBackground.setOnMouseReleased(new EventHandler<MouseEvent>() {

    public void handle(MouseEvent mouseEvent) {
        //Check if drag was backwards and if so swap dates
        if (lastSelDate!=null && firstSelDate.compareTo(lastSelDate)>0){
            Date tempDate = firstSelDate;
            firstSelDate=lastSelDate;
            lastSelDate=tempDate;
        }
        //mouse has been released so cleanup the highlight
        highlight.setX(0);
        highlight.setWidth(0);
        highlight.setVisible(false);
        //Set both sets of series in the chart to the subset selected
        if (lastSelDate != null && firstSelDate.compareTo(lastSelDate) != 0) {
            logger.info("Zooming into chart");
            removeChartFromScene();
            // show the subset of data
            new Thread(new GenerateDataTask(firstSelDate, lastSelDate, false)).start();

        }
        lastSelDate = null;

    }

});
yAxis.setOnMouseDragEntered(new EventHandler<MouseDragEvent>() {

    @Override
    public void handle(MouseDragEvent mouseEvent) {
    if (mouseEvent.isPrimaryButtonDown()){
            exitedChart = true;

            //Account for lag in listener when hitting the yAxis - pull highlight rigt to the edge
            highlight.setX(yAxis.getBoundsInParent().getMaxX());
            highlight.setWidth(origX-yAxis.getBoundsInParent().getMaxX());
    }
    }

});

//detect drag if pulled back into highlight area
highlight.setOnMouseDragEntered(new EventHandler<MouseEvent>() {

    @Override
    public void handle(MouseEvent mouseEvent) {
    if (mouseEvent.isPrimaryButtonDown()){
        exitedChart = false;
    }
    }

});
}
为了使此突出显示功能正常工作而不会遇到很多麻烦,我将图表中的大多数节点设置为对鼠标透明:
    for (Node n: chartBackground.getParent().getChildrenUnmodifiable()) {
    if (n != chartBackground && n != xAxis && n != yAxis && n != highlight) {
    n.setMouseTransparent(true);
    }
}
我的问题是,我现在正在尝试在顶部图表系列(黑色x点)上设置工具提示,但是我能够让它们工作的唯一方法是将这些节点以及它们的父节点(组)和祖父节点(XYChart)设置为不透明。在这样做时,我破坏了高亮功能。
我已经尝试过setPickOnBands,但据我所知,它只控制鼠标是否“看到”给定节点的不可见部分。如果我的理解是正确的,那么在这种情况下就行不通了,因为拖动例程需要忽略系列的可见区域(下降到图表背景),但不能忽略黑色Xs(XYChart.Data节点)。
有什么方法(除了重写鼠标处理)可以让鼠标看得见那组序列而不看得见其他的吗?
mouseTranparent属性使“节点(及其所有子节点)对鼠标事件完全透明。”,因此您不能使用此属性来获得您想要的行为。
相反,请尝试在图表上设置一个事件过滤器,该过滤器将根据事件目标有选择地忽略事件。鼠标事件的事件过滤器可以查询事件的源和目标,并选择消费事件(忽略它),或者不消费事件(允许节点的默认鼠标处理程序生效)。
如果您需要帮助查看正在发生的事件,以便决定使用或通过什么,那么您可以使用ScenicView的事件记录功能。
