
library(ggmap) # -- for geocoding, obtaining city locations
readRDS("gadm36_IND_2_sp.rds")
ind2 = gadm
最后的输出如下:
插槽“bbox”:最小最大值 x 68.186249 97.41516 y 6.754256 35.50133
插槽 “proj4string”: CRS 参数: proj=longlat datum=WGS84 no_defs ellps=WGS84 towgs84=0,0,0 eval(expr, envir, enclos) 中的错误: 找不到对象 'gadm' 回溯:
之后,下一个代码是:
# plotting districts of a State, in this case West Bengal
wb2 = (ind2[ind2$NAME_1=="West Bengal",])

nam = c("Purulia","Bankura","Midnapur")
pos = geocode(nam)
tlat = pos$lat+0.05    # -- the city name will be above the marker
cities = data.frame(nam, pos$lon,pos$lat,tlat)
names(cities)[2] = "lon"
names(cities)[3] = "lat"


text1 = list("panel.text", cities$lon, cities$tlat, cities$nam,col="red", cex = 0.75)
mark1 = list("panel.points", cities$lon, cities$lat, col="blue")
text2 = list("panel.text",87.0,26.0,"GADM map", col = "dark green", cex = 1.2)
spplot(wb2, "NAME_1",
sp.layout=list(text1,mark1, text2),
main="West Bengal Districts",
colorkey=FALSE, scales=list(draw=TRUE))
以上代码的输出是:eval(expr,envir,enclos)中的错误:未找到对象“in D2”trace back:
如何在地图上绘制位置?
您没有提供足够的信息来创建可重现的问题,但我能够将一些类似的数据放在一起,然后使用以下代码在地图上绘制您的位置。我选择使用简单的要素对象而不是空间对象。
首先,创建了一个简单的特征对象,其名称和列表列具有城市的 lon/lat。
pts.sf <- st_as_sf(city_pts, pts.sfc)
然后创建了底图。
wmap <- rnaturalearth::ne_countries(scale = 'medium', type = 'map_units', returnclass = 'sf')
india <- wmap %>% filter(admin == "India")
imap <- india$geometry
st_crs(imap) <- 4326
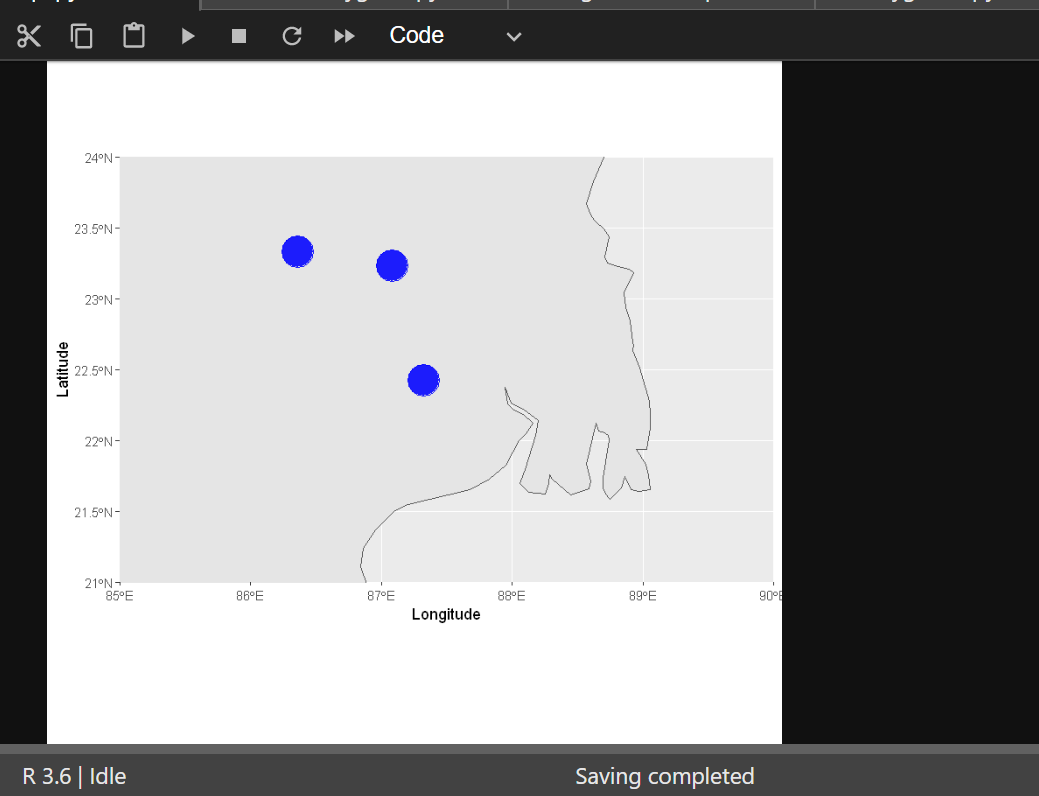
然后把这些点标绘在底图上。
my_plot <- ggplot(data = imap) +
    geom_sf() +
    geom_sf(data = pts.sf, aes(),
    fill = "blue", color = "blue", size=10, alpha=0.5 ) +
    coord_sf(xlim = c(85, 90), ylim = c(21, 24), expand = FALSE) +
    xlab("Longitude") + ylab("Latitude")

my_plot
该图在下面的链接中提供。好问题!
