
>
按照 Web 组件的 vaadin 指南创建一个仪表:
@Tag("dw-meter")
@NpmPackage(value = "echarts", version = "5.2.2")
@JsModule("../node_modules/echarts/dist/echarts.js")
@JsModule("./dwmeter.webcomponent.js")
public class DwMeter extends Div {

}
将测量仪集成到演示应用程序中:
DwMeter meter = new DwMeter();
meter.setWidth("100px");
meter.setHeight("100px");
add(meter);
应用程序已成功执行,但未显示测量仪。
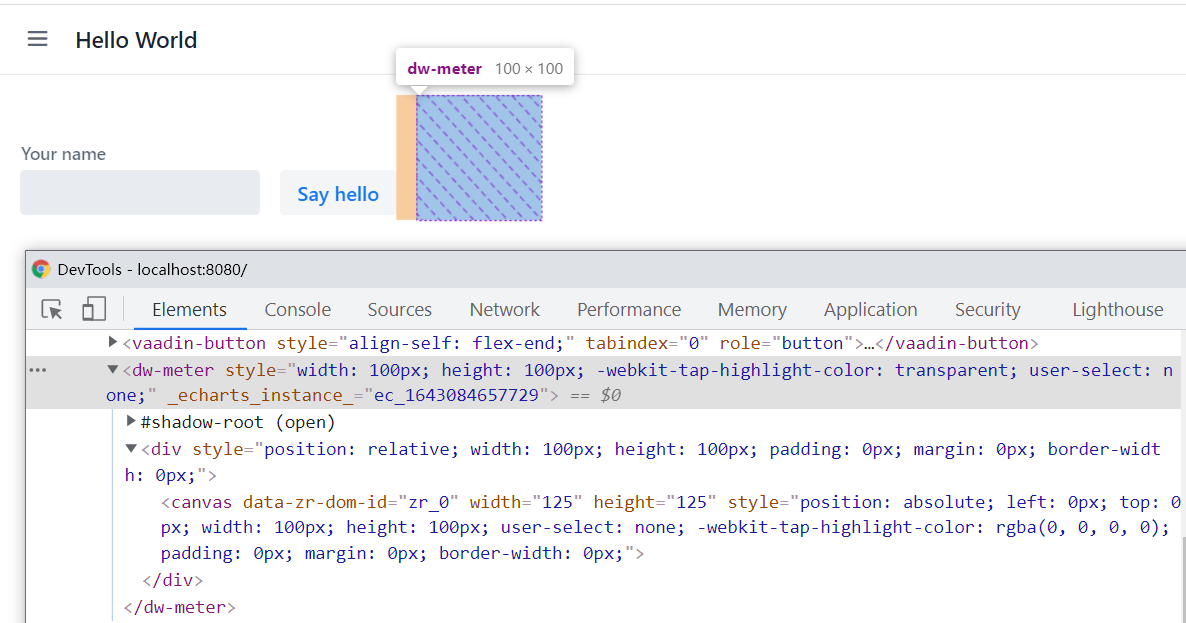
我的问题是如何可视化用户定义的vaadin Web组件?例如
附加 dwmeter.webcomponent.js:
import * as ECharts from "echarts";

class dwMeter extends HTMLElement {
    constructor() {
        super();
    }

    init(o) {
        // Shadow root
        const shadowRoot = this.attachShadow({mode: 'open'});

        // container
        var container = document.createElement('div');
        shadowRoot.appendChild(container);

        // Garantee all elements are rendered
        setTimeout(function() {

            var myChart = ECharts.init(o);  //container

            myChart.setOption(o.options());

        }, 0);

    }

    options() {
        const gaugeData = [
                {
                  value: 0.25,
                  name: 'pressure',
            title: {
              offsetCenter: ['0%', '90%']
            }
                }
              ];

        var option = {
          series: [
            {
              type: 'gauge',
              min: 0,
              max: 0.25,
              splitNumber: 5,

              progress: {
                show: false,
                width: 5
              },
              axisLine: {
                lineStyle: {
                  width: 5,
                  color: [[1, 'rgba(36,177, 76)']]
                }
              },
              axisTick: {
                show: false
              },
              splitLine: {
                length: -10,
                lineStyle: {
                  width: 5,
                  color: 'rgba(36,177, 76)'
                }
              },
              axisLabel: {
                distance: -20,
                color: '#999',
                fontSize: 10
              },
              anchor: {
                show: true,
                showAbove: true,
                size: 12,
                itemStyle: {
                  borderWidth:0,
                  color: 'rgba(36,177, 76)',
                }
              },
              pointer: {
                icon: 'path://M2.9,0.7L2.9,0.7c1.4,0,2.6,1.2,2.6,2.6v115c0,1.4-1.2,2.6-2.6,2.6l0,0c-1.4,0-2.6-1.2-2.6-2.6V3.3C0.3,1.9,1.4,0.7,2.9,0.7z',
                width: 5,
                length: '60%',
                offsetCenter: [0, '8%'],
                itemStyle: {
                  color: 'rgba(36,177, 76)'
                }
              },


                title: {
                color: 'rgba(36,177, 76)',
                fontSize: 14,
                fontWeight: 800,
                fontFamily: 'Arial',
                offsetCenter: [0, '100%']
              },

              detail: {
                valueAnimation: true,
                fontSize: 12,
                offsetCenter: [0, '55%'],
                show: true

              },
              data:gaugeData
            }
          ]
        };

        return option;
    }

    connectedCallback() {
        this.init(this);
    }

    disconnectedCallback() {
    }

    attributeChangedCallback() {
    }

    clone(origin, target) {
        var target = target || {};
        for(var prop in origin) {
            target[prop] = origin[prop];
        }
    }

}

window.customElements.define('dw-meter', dwMeter);
使用时未显示任何内容的原因
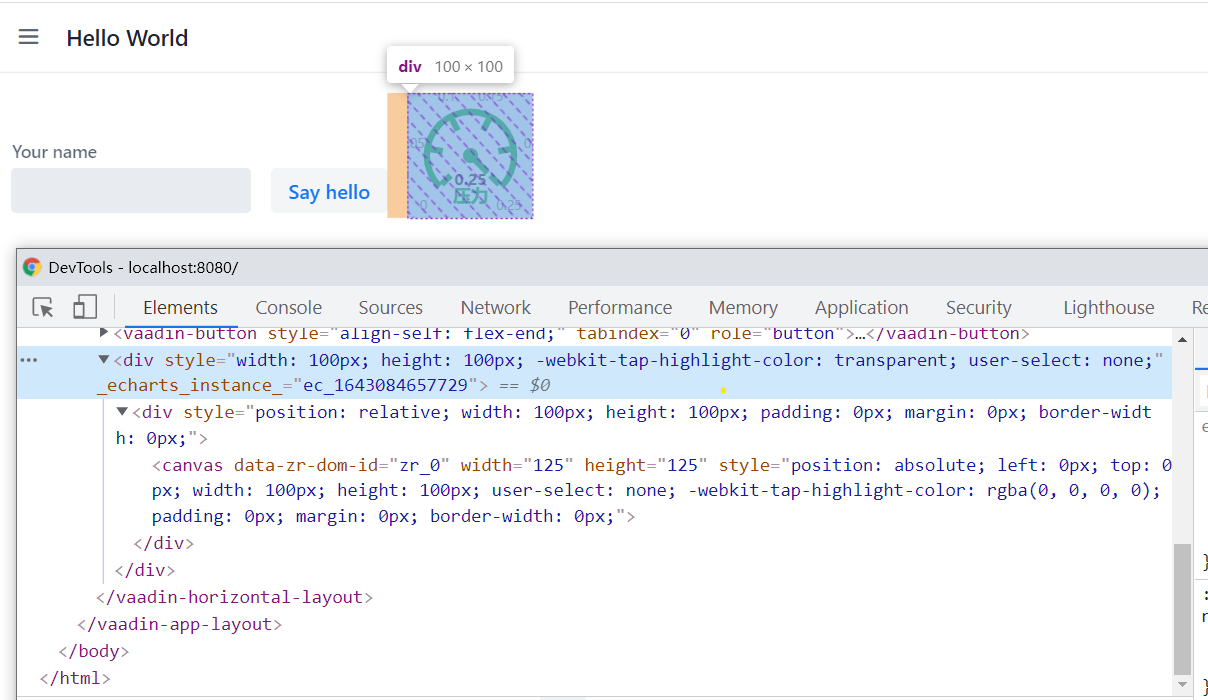
如果你想使用影子根来封装样式,那么你至少需要改变 ECharts.init(o) 来代替 ECharts.init(container)。您可能还需要更改其他内容以使其正常工作,但这取决于 ECharts 的实现方式。我假设您从服务器传递的 o 参数很可能是多余的,因为这已经是对顶级元素的引用。
