
我有一个带有Spring Cloud Sleuth、OpenTelemetry instrumentation和OpenTelemetry exporter OTLP的Spring Boot应用程序。
以下是依赖关系的要点:
>
spring cloud sleuth otel autoconfigure引入OpenTelemetry instrumentation libs并提供spring自动配置
opentelemetry exporter otlp用于向apm服务器发送数据
   <dependency>
      <groupId>org.springframework.cloud</groupId>
      <artifactId>spring-cloud-starter-sleuth</artifactId>
      <exclusions>
          <exclusion>
              <groupId>org.springframework.cloud</groupId>
              <artifactId>spring-cloud-sleuth-brave</artifactId>
          </exclusion>
      </exclusions>
  </dependency>

  <dependency>
      <groupId>org.springframework.cloud</groupId>
      <artifactId>spring-cloud-sleuth-otel-autoconfigure</artifactId>
  </dependency>

  <dependency>
      <groupId>io.opentelemetry</groupId>
      <artifactId>opentelemetry-exporter-otlp</artifactId>
  </dependency>
  <!-- https://mvnrepository.com/artifact/io.grpc/grpc-netty -->
  <dependency>
      <groupId>io.grpc</groupId>
      <artifactId>grpc-netty-shaded</artifactId>
      <version>1.43.0</version>
  </dependency>
我的application.yml中只有基本配置:
spring:
  sleuth:
    enabled: true
    otel:
      config:
        trace-id-ratio-based: 1.0
      exporter:
        otlp:
          endpoint: http://localhost:8200
通过这个设置,我成功地在APM中看到了一些数据。示例屏幕:
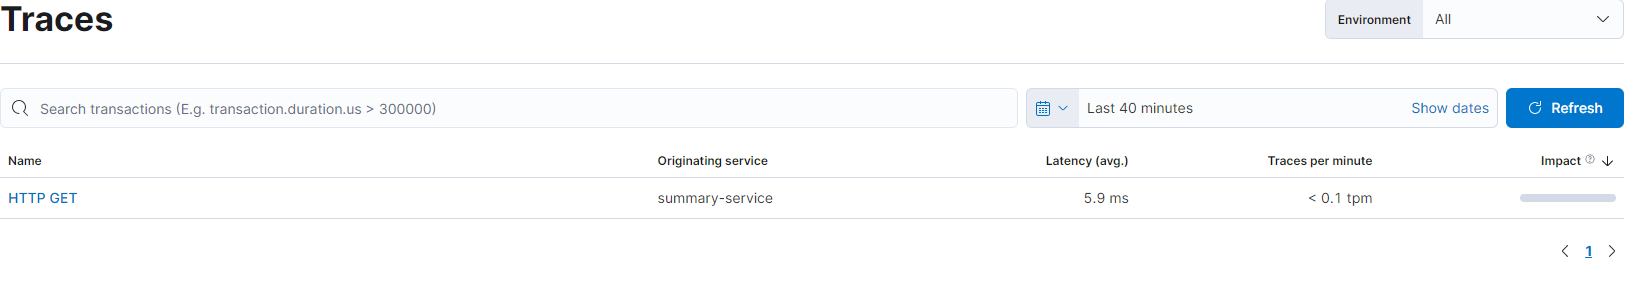
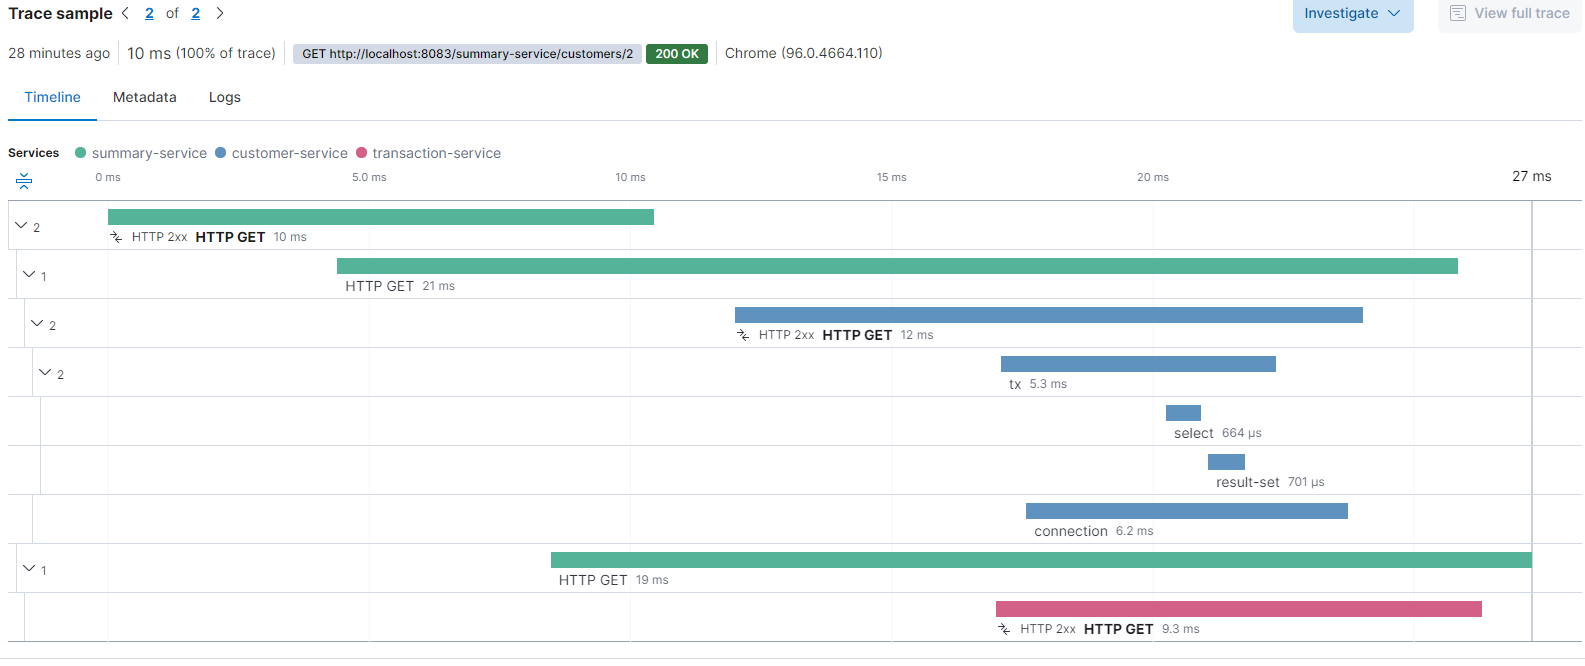
然而,如果我看看弹性留档,我看到他们的屏幕上有额外的数据:痕迹。
对我来说,它看起来缺少span和事务名称(我只看到HTTP GET而不是名称),至少它们存在于留档映像中。
有人知道为什么会发生这种情况以及如何解决吗?
这是弹性中的示例跟踪文档:
const EXAMPLE = {
  "_index": "apm-7.15.2-metric-000001",
  "_type": "_doc",
  "_id": "AYVKCH8BxjGANUnHPDgq",
  "_version": 1,
  "_score": 1,
  "_source": {
    "_doc_count": 2,
    "agent": {
      "name": "opentelemetry/java"
    },
    "processor": {
      "name": "metric",
      "event": "metric"
    },
    "transaction.duration.histogram": {
      "counts": [
        1,
        1
      ],
      "values": [
        1439,
        10495
      ]
    },
    "metricset.name": "transaction",
    "observer": {
      "hostname": "0798ff612508",
      "id": "6a12bcef-5e7e-45b3-aee6-f2af4e175c3f",
      "ephemeral_id": "389ee9b1-d4c4-4d67-b46a-bfcaa77b7b79",
      "type": "apm-server",
      "version": "7.15.2",
      "version_major": 7
    },
    "@timestamp": "2022-02-17T15:25:56.160Z",
    "timeseries": {
      "instance": "summary-service:HTTP GET:11ed2dc65a946e45"
    },
    "ecs": {
      "version": "1.11.0"
    },
    "service": {
      "name": "summary-service"
    },
    "event": {
      "ingested": "2022-02-17T15:25:57.161730700Z",
      "outcome": "success"
    },
    "transaction": {
      "result": "HTTP 2xx",
      "root": true,
      "name": "HTTP GET",
      "type": "request"
    }
  },
  "fields": {
    "transaction.name.text": [
      "HTTP GET"
    ],
    "_doc_count": [
      2
    ],
    "service.name": [
      "summary-service"
    ],
    "processor.name": [
      "metric"
    ],
    "observer.version_major": [
      7
    ],
    "observer.hostname": [
      "0798ff612508"
    ],
    "transaction.result": [
      "HTTP 2xx"
    ],
    "transaction.duration.histogram": [
      {
        "counts": [
          1,
          1
        ],
        "values": [
          1439,
          10495
        ]
      }
    ],
    "transaction.type": [
      "request"
    ],
    "metricset.name": [
      "transaction"
    ],
    "observer.id": [
      "6a12bcef-5e7e-45b3-aee6-f2af4e175c3f"
    ],
    "event.ingested": [
      "2022-02-17T15:25:57.161Z"
    ],
    "@timestamp": [
      "2022-02-17T15:25:56.160Z"
    ],
    "observer.ephemeral_id": [
      "389ee9b1-d4c4-4d67-b46a-bfcaa77b7b79"
    ],
    "timeseries.instance": [
      "summary-service:HTTP GET:11ed2dc65a946e45"
    ],
    "observer.version": [
      "7.15.2"
    ],
    "ecs.version": [
      "1.11.0"
    ],
    "observer.type": [
      "apm-server"
    ],
    "transaction.root": [
      true
    ],
    "processor.event": [
      "metric"
    ],
    "transaction.name": [
      "HTTP GET"
    ],
    "agent.name": [
      "opentelemetry/java"
    ],
    "event.outcome": [
      "success"
    ]
  }
}
对我来说,它看起来像span和事务名称丢失(我只看到HTTP GET而不是名称)
不,它们没有丢失。您将名称视为HTTP GET的原因是由于首选较少的基数名称和跟踪数据的语义约定。这里有一个关于HTTP跨度命名约定的详细解释https://github.com/open-telemetry/opentelemetry-specification/blob/main/specification/trace/semantic_conventions/http.md#name.自动检测库生成的任何数据都将遵守语义约定规范。我猜链接供应商的可视化来自手动检测,作为最终用户,您可以给出任何名称(尽管建议每个人使用较少的基数值,但没有强制执行)。我不认为这里有什么你可以“修复”的。
