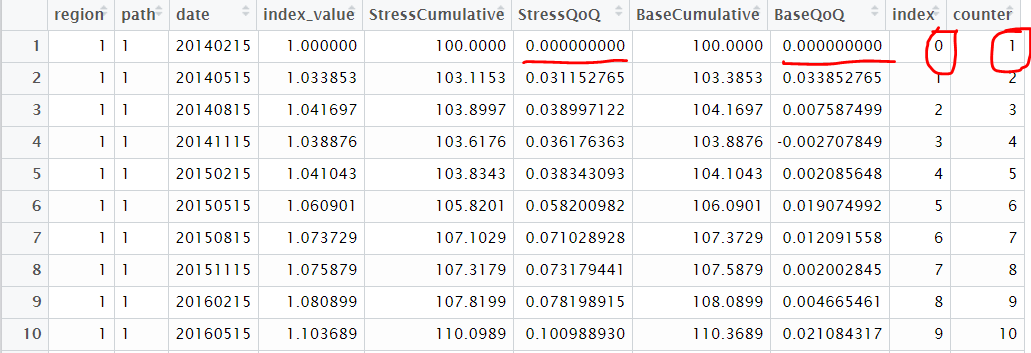

在第1:167行中的日期范围内,为Stress累积、Base累积、StressQoQ和BaseQoQ的每个区域创建一个图。
我很难对数据进行子集设置。框架我的问题是,我子集的条件是合乎逻辑的,因此将只返回条件之后的第一个元素。
subset_region_1 <- subset.data.frame(HPF, HPF$region == 1, select = BaseCumulative, HPF$StressCumulative, StressQoQ, BaseQoQ)

Warning messages:
1: In if (drop) warningc("drop ignored") :
  the condition has length > 1 and only the first element will be used
2: drop ignored
它只返回第一列BaseCum的值。

我想创建一个子集,以便在第1:167行的日期范围内绘制BaseCumerative、StressCumulative、BaseQoQ和StressQoQ变量。“日期”列对所有100个区域使用相同的日期。我的问题是,当我转到ggplot中的plot时,我得到一个错误,即我的aes映射大小不同。完整表的date=18370行长,但值每167行重复一次(对于每个唯一区域)。此外,BaseCumulative变量也有18370行长,但对于所有区域都是唯一的,即每167行。我想知道如何在获得我感兴趣的变量的正确行大小的同时按区域进行子集划分。
#Rows 1-3 (Region 1 Sample):
dput(head(HPF[1:3, ]))
    structure(list(region = c(1, 1, 1), path = c(1, 1, 1), date = c(20140215,
    20140515, 20140815), index_value = c(1, 1.033852765, 1.041697122
    ), index = 0:2, counter = 1:3, BaseQoQ = c(NA, 0.033852765, 0.00758749917354029
    ), BaseCumulative = c(100, 103.3852765, 104.1697122), StressCumulative = c(110,
    113.3852765, 114.1697122), StressQoQ = c(NA, 0.0307752409090909,
    0.00691832065162346)), .Names = c("region", "path", "date", "index_value",
    "index", "counter", "BaseQoQ", "BaseCumulative", "StressCumulative",
    "StressQoQ"), row.names = c(NA, -3L), class = c("tbl_df", "tbl",
    "data.frame"))

#Rows 168:200 (Region 2 Sample):
dput(head(HPF[168:200, ]))
    structure(list(region = c(2, 2, 2, 2, 2, 2), path = c(1, 1, 1,
    1, 1, 1), date = c(20140215, 20140515, 20140815, 20141115, 20150215,
    20150515), index_value = c(1, 1.014162265, 1.01964828, 1.009372314,
    1.007210703, 1.018695493), index = 0:5, counter = 1:6, BaseQoQ = c(NA,
    0.014162265, 0.00540940556489744, -0.0100779515854232, -0.0021415398163972,
    0.0114025694582001), BaseCumulative = c(100, 101.4162265, 101.964828,
    100.9372314, 100.7210703, 101.8695493), StressCumulative = c(110,
    111.4162265, 111.964828, 110.9372314, 110.7210703, 101.8695493
    ), StressQoQ = c(NA, 0.0128747863636363, 0.00492389230216839,
    -0.00917785181610786, -0.00194849914020834, -0.0799443229370588
    )), .Names = c("region", "path", "date", "index_value", "index",
    "counter", "BaseQoQ", "BaseCumulative", "StressCumulative", "StressQoQ"
    ), row.names = c(NA, -6L), class = c("tbl_df", "tbl", "data.frame"
    ))
除了指定region==#之外,我如何子集其他列?我尝试了以下方法,但问题是日期和图表的值不正确:
ggplot(HPF, aes(x = date, y= BaseCumulative, linetype = factor(region == 1))) +
  geom_line() +
  theme_light()
此外,如果我尝试在ggplot中创建子集,例如:
ggplot(HPF[HPF$region == 1, ], aes(x = HPF$date[1:167, ], y= HPF$BaseCumulative[1:167, ], linetype = factor(region == 1))) +
      geom_line() +
      theme_light()
任何帮助都很感激。
我不完全确定你想在情节中表现什么;这就是你想要的吗?
library(tidyverse);
df %>%
    gather(what, value, 7:10) %>%
    ggplot(aes(date, value, colour = what)) + geom_line() + theme_light()

说明:将您的数据从宽格式转换为长格式,然后将What作为颜色(或线型)美感传递,以获得一个情节中列7, 8, 9, 10的不同线图。
如果您想为区域单独绘制,可以添加面_-wrap(~as.factor(region)),例如。
df %>%
    gather(what, value, 7:10) %>%
    ggplot(aes(date, value, colour = what)) + geom_line() + theme_light() + facet_wrap(~ as.factor(region))

df1 <- structure(list(region = c(1, 1, 1), path = c(1, 1, 1), date = c(20140215,
    20140515, 20140815), index_value = c(1, 1.033852765, 1.041697122
    ), index = 0:2, counter = 1:3, BaseQoQ = c(NA, 0.033852765, 0.00758749917354029
    ), BaseCumulative = c(100, 103.3852765, 104.1697122), StressCumulative = c(110,
    113.3852765, 114.1697122), StressQoQ = c(NA, 0.0307752409090909,
    0.00691832065162346)), .Names = c("region", "path", "date", "index_value",
    "index", "counter", "BaseQoQ", "BaseCumulative", "StressCumulative",
    "StressQoQ"), row.names = c(NA, -3L), class = c("tbl_df", "tbl",
    "data.frame"));

df2 <- structure(list(region = c(2, 2, 2, 2, 2, 2), path = c(1, 1, 1,
    1, 1, 1), date = c(20140215, 20140515, 20140815, 20141115, 20150215,
    20150515), index_value = c(1, 1.014162265, 1.01964828, 1.009372314,
    1.007210703, 1.018695493), index = 0:5, counter = 1:6, BaseQoQ = c(NA,
    0.014162265, 0.00540940556489744, -0.0100779515854232, -0.0021415398163972,
    0.0114025694582001), BaseCumulative = c(100, 101.4162265, 101.964828,
    100.9372314, 100.7210703, 101.8695493), StressCumulative = c(110,
    111.4162265, 111.964828, 110.9372314, 110.7210703, 101.8695493
    ), StressQoQ = c(NA, 0.0128747863636363, 0.00492389230216839,
    -0.00917785181610786, -0.00194849914020834, -0.0799443229370588
    )), .Names = c("region", "path", "date", "index_value", "index",
    "counter", "BaseQoQ", "BaseCumulative", "StressCumulative", "StressQoQ"
    ), row.names = c(NA, -6L), class = c("tbl_df", "tbl", "data.frame"
    ))

df <- rbind.data.frame(df1, df2);