
我想在python中更改plotly express中的变量/标签名称。我首先创建一个绘图:
import pandas as pd
import plotly.express as px

d = {'col1': [1, 2, 3], 'col2': [3, 4, 5]}
df = pd.DataFrame(data=d)
fig = px.line(df, x=df.index, y=['col1', 'col2'])
fig.show()
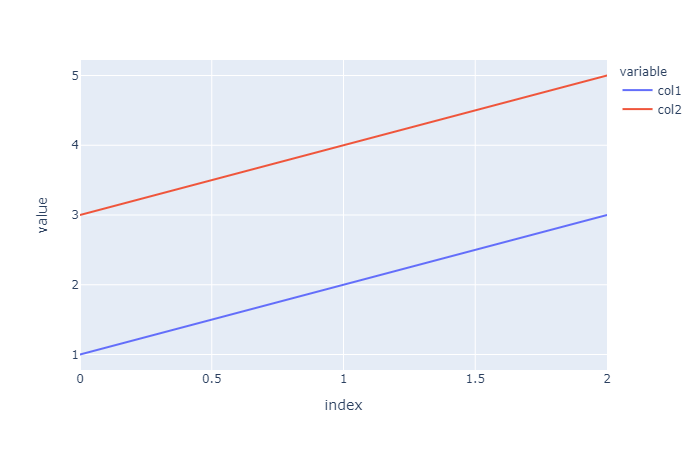
其产生:

我想把标签名从col1改为hello,从col2改为hi。我已尝试在图中使用标签,但无法使其正常工作:
fig = px.line(df, x=df.index, y=['col1', 'col2'], labels={'col1': "hello", 'col2': "hi"})
fig.show()
但这似乎没有什么作用,同时也不会产生错误。显然,我可以通过更改列名来实现我的目标,但我试图创建的实际绘图实际上并不允许这样做,因为它来自多个不同的数据帧。
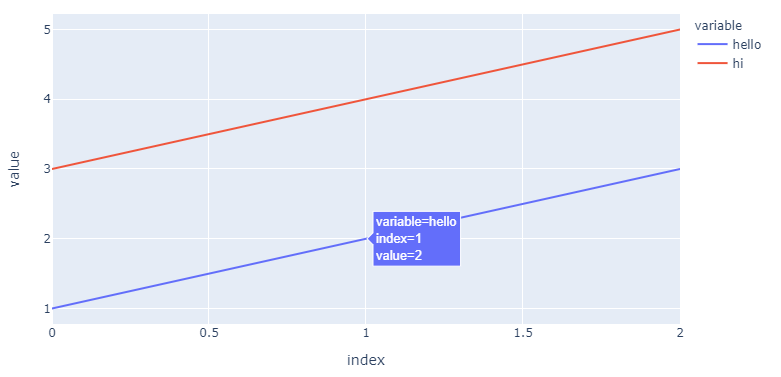
在不更改数据源的情况下,完全替换图例、Legendgroup和hover模板中的名称需要:
newnames = {'col1':'hello', 'col2': 'hi'}
fig.for_each_trace(lambda t: t.update(name = newnames[t.name],
                                      legendgroup = newnames[t.name],
                                      hovertemplate = t.hovertemplate.replace(t.name, newnames[t.name])
                                     )
                  )

使用
fig.for_each_trace(lambda t: t.update(name = newnames[t.name]))
...您可以使用dict更改图例中的名称,而无需更改源
newnames = {'col1':'hello', 'col2': 'hi'}
...并将新名称映射到图形结构的以下部分中现有的col1和col2(对于第一个跟踪,col1):
{'hovertemplate': 'variable=col1<br>index=%{x}<br>value=%{y}<extra></extra>',
'legendgroup': 'col1',
'line': {'color': '#636efa', 'dash': 'solid'},
'mode': 'lines',
'name': 'hello',   # <============================= here!
'orientation': 'v',
'showlegend': True,
'type': 'scatter',
'x': array([0, 1, 2], dtype=int64),
'xaxis': 'x',
'y': array([1, 2, 3], dtype=int64),
'yaxis': 'y'},
但正如您所看到的,这对'legendgroup':'col1'和'hovertemplate':'variable=col1'没有任何作用
import pandas as pd
import plotly.express as px
from itertools import cycle

d = {'col1': [1, 2, 3], 'col2': [3, 4, 5]}
df = pd.DataFrame(data=d)
fig = px.line(df, x=df.index, y=['col1', 'col2'])

newnames = {'col1':'hello', 'col2': 'hi'}
fig.for_each_trace(lambda t: t.update(name = newnames[t.name],
                                      legendgroup = newnames[t.name],
                                      hovertemplate = t.hovertemplate.replace(t.name, newnames[t.name])
                                     )
                  )
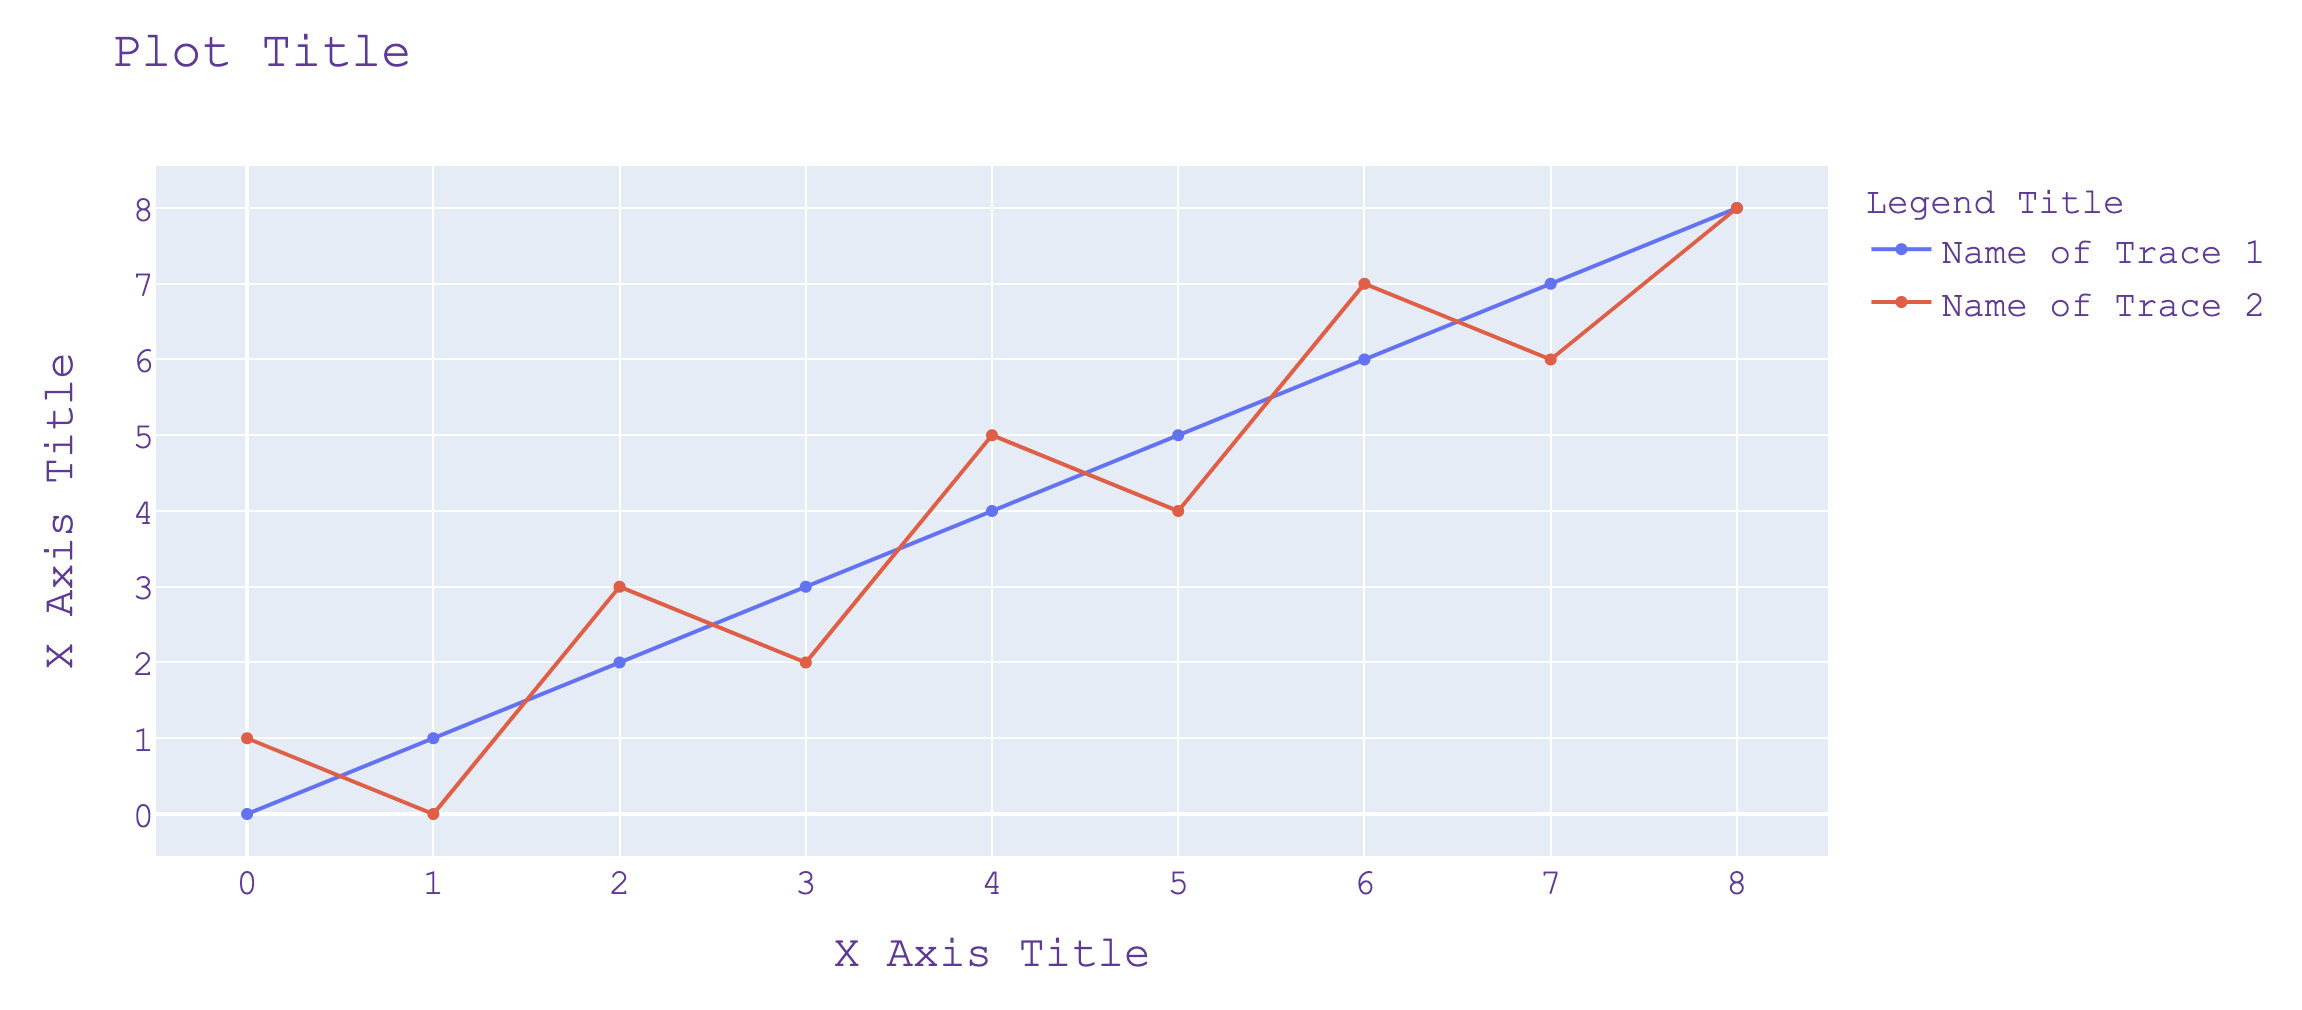
添加“name”参数:go。分散(名称=…)
来源https://plotly.com/python/figure-labels/
fig = go.Figure()

fig.add_trace(go.Scatter(
    x=[0, 1, 2, 3, 4, 5, 6, 7, 8],
    y=[0, 1, 2, 3, 4, 5, 6, 7, 8],
    name="Name of Trace 1"       # this sets its legend entry
))


fig.add_trace(go.Scatter(
    x=[0, 1, 2, 3, 4, 5, 6, 7, 8],
    y=[1, 0, 3, 2, 5, 4, 7, 6, 8],
    name="Name of Trace 2"
))

fig.update_layout(
    title="Plot Title",
    xaxis_title="X Axis Title",
    yaxis_title="X Axis Title",
    legend_title="Legend Title",
    font=dict(
        family="Courier New, monospace",
        size=18,
        color="RebeccaPurple"
    )
)

fig.show()

这段代码更加简洁。
import pandas as pd
import plotly.express as px

df = pd.DataFrame(data={'col1': [1, 2, 3], 'col2': [3, 4, 5]})

series_names = ["hello", "hi"]

fig = px.line(data_frame=df)

for idx, name in enumerate(series_names):
    fig.data[idx].name = name
    fig.data[idx].hovertemplate = name

fig.show()