JFreeChart 甘特图
什么是JFreeChart 甘特图
甘特图是一种条形图,常用于计划和安排项目任务和事件。
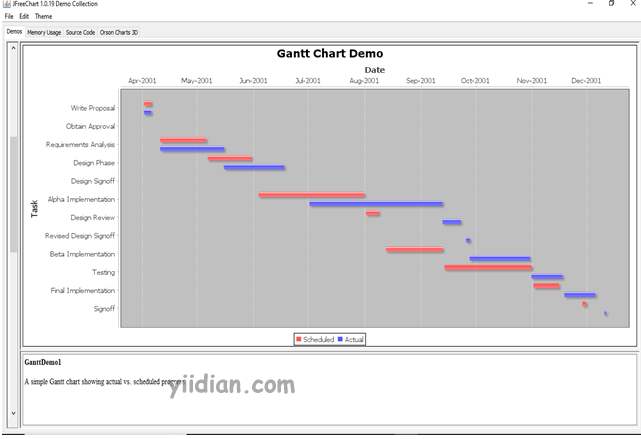
下图显示了 JFreeChart 库中包含的甘特图的一些演示版本:

JFreeChart 甘特图的示例
让我们以人口数量作为样本数据。
| 软件开发阶段 | 预计日期 | 实际日期 | ||
|---|---|---|---|---|
| 需求分析 | 2017-07-03 | 2017-07-07 | 2017-07-03 | 2017-07-05 |
| 需求设计 | 2017-07-10 | 2017-07-14 | 2017-07-06 | 2017-07-17 |
| 编码 | 2017-07-17 | 2017-07-21 | 2017-07-18 | 2017-07-27 |
| 测试 | 2017-07-24 | 2017-07-28 | 2017-07-28 | 2017-08-01 |
| 部署 | 2017-07-31 | 2017-08-04 | 2017-08-02 | 2017-08-04 |
以下代码根据上述示例数据创建甘特图:
package com.yiidian;

import org.jfree.chart.ChartFactory;
import org.jfree.chart.ChartPanel;
import org.jfree.chart.JFreeChart;
import org.jfree.data.category.IntervalCategoryDataset;
import org.jfree.data.gantt.Task;
import org.jfree.data.gantt.TaskSeries;
import org.jfree.data.gantt.TaskSeriesCollection;

import javax.swing.*;
import java.time.LocalDate;
import java.time.ZoneOffset;
import java.util.Date;

public class GanttChartExample extends JFrame {

    private static final long serialVersionUID = 1L;

    public GanttChartExample(String title) {
        super(title);
        // Create dataset
        IntervalCategoryDataset dataset = getCategoryDataset();

        // Create chart
        JFreeChart chart = ChartFactory.createGanttChart(
                "Gantt Chart Example", // Chart title
                "Software Development Phases", // X-Axis Label
                "Timeline", // Y-Axis Label
                dataset);

        ChartPanel panel = new ChartPanel(chart);
        setContentPane(panel);
    }

    private IntervalCategoryDataset getCategoryDataset() {

        TaskSeries series1 = new TaskSeries("Estimated Date");
        series1.add(new Task("Requirement",
                Date.from(LocalDate.of(2017, 7, 3).atStartOfDay().toInstant(ZoneOffset.UTC)),
                Date.from(LocalDate.of(2017, 7, 7).atStartOfDay().toInstant(ZoneOffset.UTC))
        ));

        series1.add(new Task("Design", Date.from(LocalDate.of(2017, 7, 10).atStartOfDay().toInstant(ZoneOffset.UTC)),
                Date.from(LocalDate.of(2017, 7, 14).atStartOfDay().toInstant(ZoneOffset.UTC))
        ));

        series1.add(new Task("Coding", Date.from(LocalDate.of(2017, 7, 17).atStartOfDay().toInstant(ZoneOffset.UTC)),
                Date.from(LocalDate.of(2017, 7, 21).atStartOfDay().toInstant(ZoneOffset.UTC))
        ));

        series1.add(new Task("Testing", Date.from(LocalDate.of(2017, 7, 24).atStartOfDay().toInstant(ZoneOffset.UTC)),
                Date.from(LocalDate.of(2017, 7, 28).atStartOfDay().toInstant(ZoneOffset.UTC))
        ));

        series1.add(new Task("Deployment", Date.from(LocalDate.of(2017, 07, 31).atStartOfDay().toInstant(ZoneOffset.UTC)),
                Date.from(LocalDate.of(2017, 8, 4).atStartOfDay().toInstant(ZoneOffset.UTC))
        ));


        TaskSeries series2 = new TaskSeries("Actual Date");
        series2.add(new Task("Requirement", Date.from(LocalDate.of(2017, 7, 3).atStartOfDay().toInstant(ZoneOffset.UTC)),
                Date.from(LocalDate.of(2017, 7, 05).atStartOfDay().toInstant(ZoneOffset.UTC))
        ));

        series2.add(new Task("Design",
                Date.from(LocalDate.of(2017, 7, 6).atStartOfDay().toInstant(ZoneOffset.UTC)),
                Date.from(LocalDate.of(2017, 7, 17).atStartOfDay().toInstant(ZoneOffset.UTC))
        ));

        series2.add(new Task("Coding",
                Date.from(LocalDate.of(2017, 7, 18).atStartOfDay().toInstant(ZoneOffset.UTC)),
                Date.from(LocalDate.of(2017, 7, 27).atStartOfDay().toInstant(ZoneOffset.UTC))
        ));

        series2.add(new Task("Testing",
                Date.from(LocalDate.of(2017, 7, 28).atStartOfDay().toInstant(ZoneOffset.UTC)),
                Date.from(LocalDate.of(2017, 8, 1).atStartOfDay().toInstant(ZoneOffset.UTC))
        ));

        series2.add(new Task("Deployment",
                Date.from(LocalDate.of(2017, 8, 2).atStartOfDay().toInstant(ZoneOffset.UTC)),
                Date.from(LocalDate.of(2017, 8, 4).atStartOfDay().toInstant(ZoneOffset.UTC))
        ));

        TaskSeriesCollection dataset = new TaskSeriesCollection();
        dataset.add(series1);
        dataset.add(series2);
        return dataset;
    }

    public static void main(String[] args) {
        SwingUtilities.invokeLater(() -> {
            GanttChartExample example = new GanttChartExample("一点教程网:Gantt Chart Example");
            example.setSize(800, 400);
            example.setLocationRelativeTo(null);
            example.setDefaultCloseOperation(WindowConstants.EXIT_ON_CLOSE);
            example.setVisible(true);
        });
    }
}
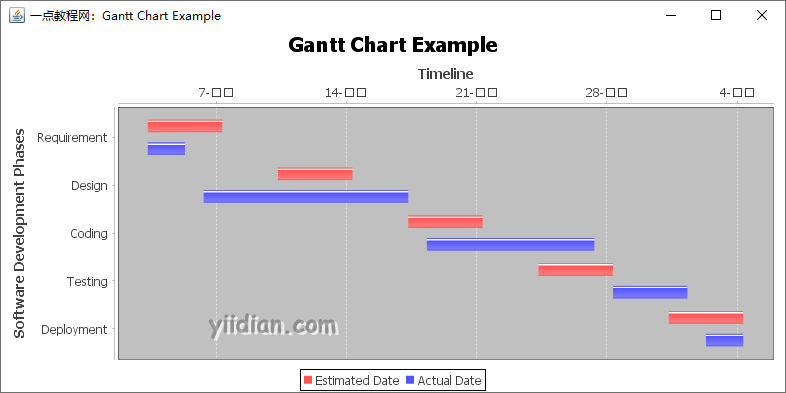
输出结果为:

热门文章
优秀文章


